Pricing Your House Right Still Matters Today

While this isn’t the frenzied market we saw during the ‘unicorn’ years, homes that are priced right are still selling quickly and seeing multiple offers right now. That’s because the number of homes for sale is still so low. Data from the National Association of Realtors (NAR) shows 76% of homes sold within a month and the average saw 3.5 offers in June.

To set yourself up to see advantages like these, you need to rely on an agent. Only an agent has the expertise needed to find the right asking price for your house. Here’s what’s at stake if that price isn’t accurate for today’s market value.

The price you set for your house sends a message to potential buyers.

Price it too low and you might raise questions about your home’s condition or lead buyers to assume something is wrong with it. Not to mention, if you undervalue your house, you could leave money on the table, which decreases your future buying power.

On the other hand, price it too high and you run the risk of deterring buyers from ever touring it in the first place. When that happens, you may have to do a price drop to try to re-ignite interest in your house when it sits on the market for a while. But be aware that a price drop can be seen as a red flag for some buyers who will wonder why the price was reduced and what that means about the home.

recent article from NerdWallet sums it up like this:

Your house’s market debut is your first chance to attract a buyer and it’s important to get the pricing right. If your home is overpriced, you run the risk of buyers not seeing the listing . . . But price your house too low and you could end up leaving some serious money on the table. A bargain-basement price could also turn some buyers away, as they may wonder if there are any underlying problems with the house.”

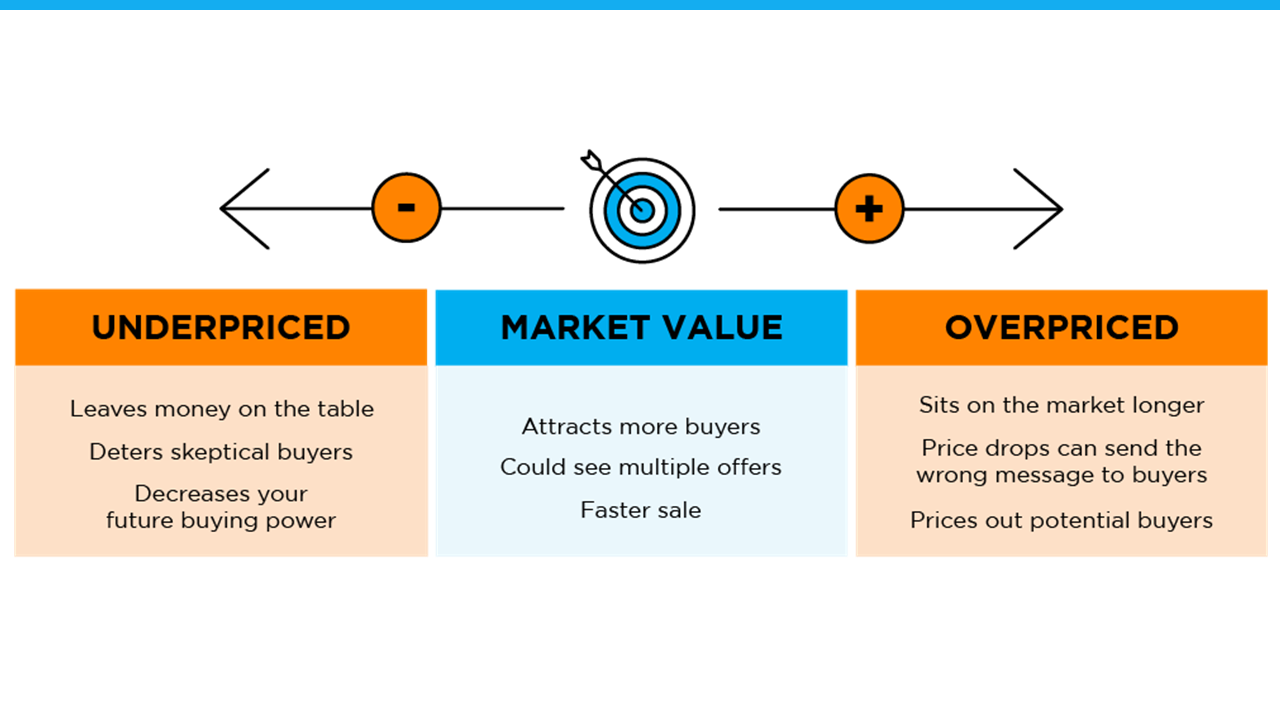
Think of pricing your home as a target. Your goal is to aim directly for the center – not too high, not too low, but right at market value.

Pricing your house fairly based on market conditions increases the chance you’ll have more buyers who are interested in purchasing it. That makes it more likely you’ll see multiple offers too. Plus, when homes are priced right, they still tend to sell quickly.

To get a high-level look into the potential downsides of over or underpricing your house and the perks that come with pricing it at market value, see the chart below:

Lean on a Professional’s Expertise to Price Your House Right

So why is an agent essential in finding the right price? Your local agent has the skill and the insight necessary to find the market value of your home. They’ll use their expertise to determine a realistic listing price by assessing:

  • The prices of recently sold homes
  • The current market conditions
  • The size and condition of your house
  • The location of your house

Bottom Line

Pricing your house at market value is critical, so don’t rely on guesswork. Let’s connect to make sure your house is priced right for today’s market.

Don’t Fall for the Next Shocking Headlines About Home Prices

If you’re thinking of buying or selling a home, one of the biggest questions you have right now is probably: what’s happening with home prices? And it’s no surprise you don’t have the clarity you need on that topic. Part of the issue is how headlines are talking about prices.

They’re basing their negative news by comparing current stats to the last few years. But you can’t compare this year to the ‘unicorn’ years (when home prices reached record highs that were unsustainable). And as prices begin to normalize now, they’re talking about it like it’s a bad thing and making people fear what’s next. But the worst home price declines are already behind us. What we’re starting to see now is the return to more normal home price appreciation.

To help make home price trends easier to understand, let’s focus on what’s typical for the market and omit the last few years since they were anomalies. 

Let’s start by talking about seasonality in real estate. In the housing market, there are predictable ebbs and flows that happen each year. Spring is the peak homebuying season when the market is most active. That activity is typically still strong in the summer but begins to wane as the cooler months approach. Home prices follow along with seasonality because prices appreciate most when something is in high demand.

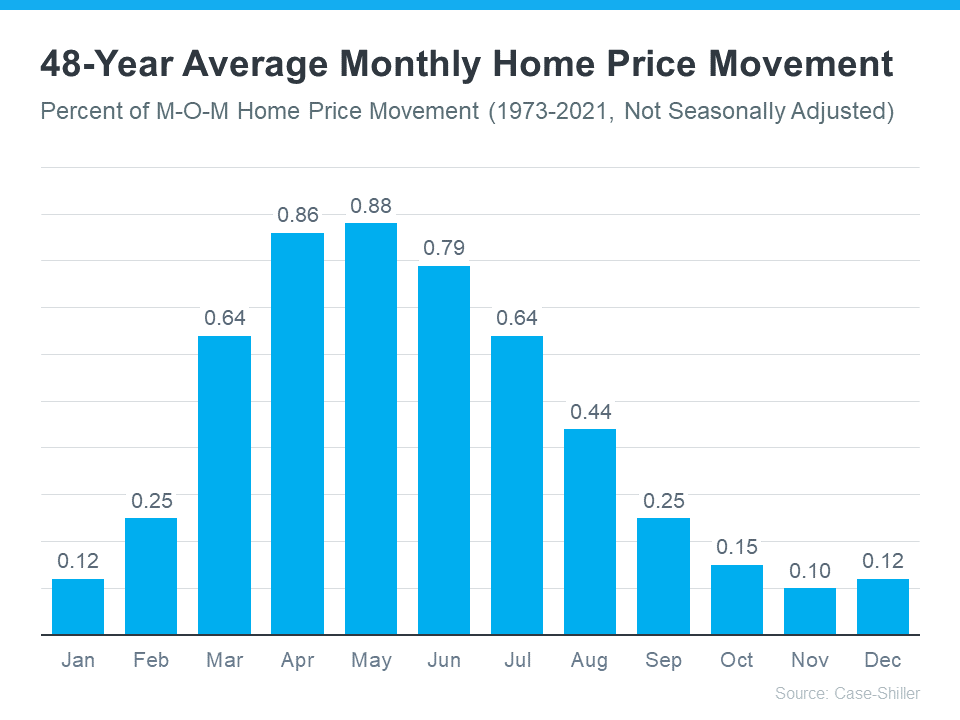
That’s why, before the abnormal years we just experienced, there was a reliable long-term home price trend. The graph below uses data from Case-Shiller to show typical monthly home price movement from 1973 through 2021 (not adjusted, so you can see the seasonality):

As the data from the last 48 years shows, at the beginning of the year, home prices grow, but not as much as they do entering the spring and summer markets. That’s because the market is less active in January and February since fewer people move in the cooler months. As the market transitions into the peak homebuying season in the spring, activity ramps up, and home prices go up a lot more in response. Then, as fall and winter approach, activity eases again. Price growth slows, but still typically appreciates.

Why This Is So Important to Understand

In the coming months, as the housing market moves further into a more predictable seasonal rhythm, you’re going to see even more headlines that either get what’s happening with home prices wrong or, at the very least, are misleading. Those headlines might use a number of price terms, like:

  • Appreciation: when prices increase.
  • Deceleration of appreciation: when prices continue to appreciate, but at a slower or more moderate pace.
  • Depreciation: when prices decrease.

They’re going to mistake the slowing home price growth (deceleration of appreciation) that’s typical of market seasonality in the fall and winter and think prices are falling (depreciation). Don’t let those headlines confuse you or spark fear. Instead, remember it’s normal to see a deceleration of appreciation, slowing home price growth, as the months go by.

Bottom Line

If you have questions about what’s happening with home prices in our local area, let’s connect.

Are Home Prices Going Up or Down? That Depends…

Media coverage about what’s happening with home prices can be confusing. A large part of that is due to the type of data being used and what they’re choosing to draw attention to. For home prices, there are two different methods used to compare home prices over different time periods: year-over-year (Y-O-Y) and month-over-month (M-O-M). Here’s an explanation of each. 

Year-over-Year (Y-O-Y):
  • This comparison measures the change in home prices from the same month or quarter in the previous year. For example, if you’re comparing Y-O-Y home prices for April 2023, you would compare them to the home prices for April 2022.
  • Y-O-Y comparisons focus on changes over a one-year period, providing a more comprehensive view of long-term trends. They are usually useful for evaluating annual growth rates and determining if the market is generally appreciating or depreciating.
Month-over-Month (M-O-M):
  • This comparison measures the change in home prices from one month to the next. For instance, if you’re comparing M-O-M home prices for April 2023, you would compare them to the home prices for March 2023.
  • Meanwhile, M-O-M comparisons analyze changes within a single month, giving a more immediate snapshot of short-term movements and price fluctuations. They are often used to track immediate shifts in demand and supply, seasonal trends, or the impact of specific events on the housing market.

The key difference between Y-O-Y and M-O-M comparisons lies in the time frame being assessed. Both approaches have their own merits and serve different purposes depending on the specific analysis required.

Why Is This Distinction So Important Right Now? 

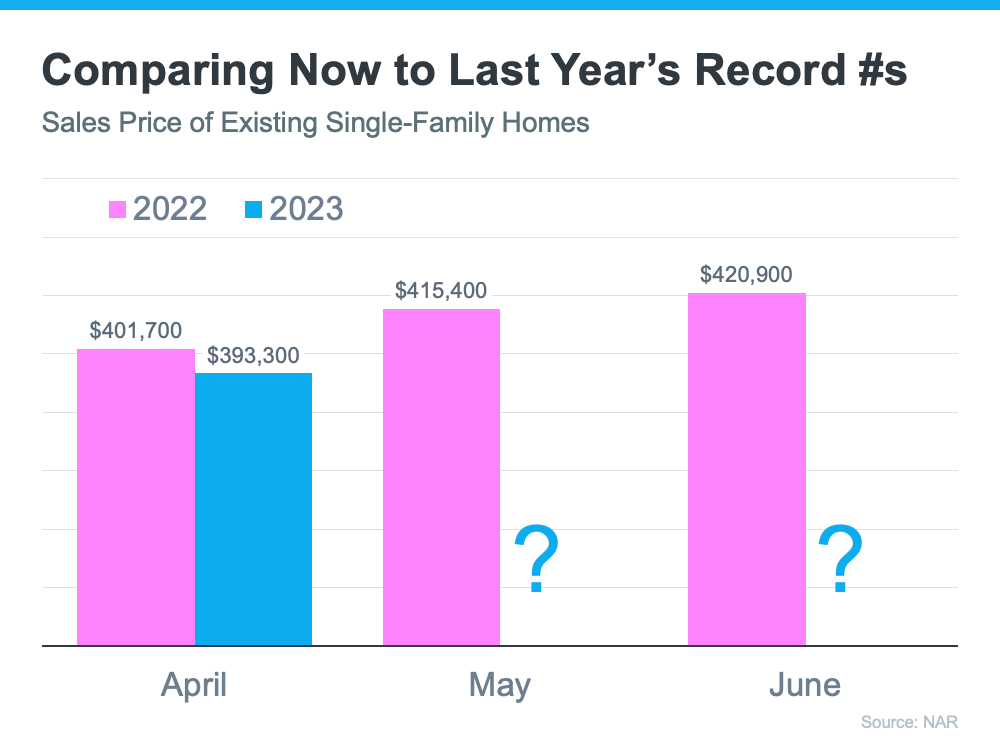
We’re about to enter a few months when home prices could possibly be lower than they were the same month last year. April, May, and June of 2022 were three of the best months for home prices in the history of the American housing market. Those same months this year might not measure up. That means, the Y-O-Y comparison will probably show values are depreciating. The numbers for April seem to suggest that’s what we’ll see in the months ahead (see graph below):

That’ll generate troubling headlines that say home values are falling. That’ll be accurate on a Y-O-Y basis. And, those headlines will lead many consumers to believe that home values are currently cascading downward.

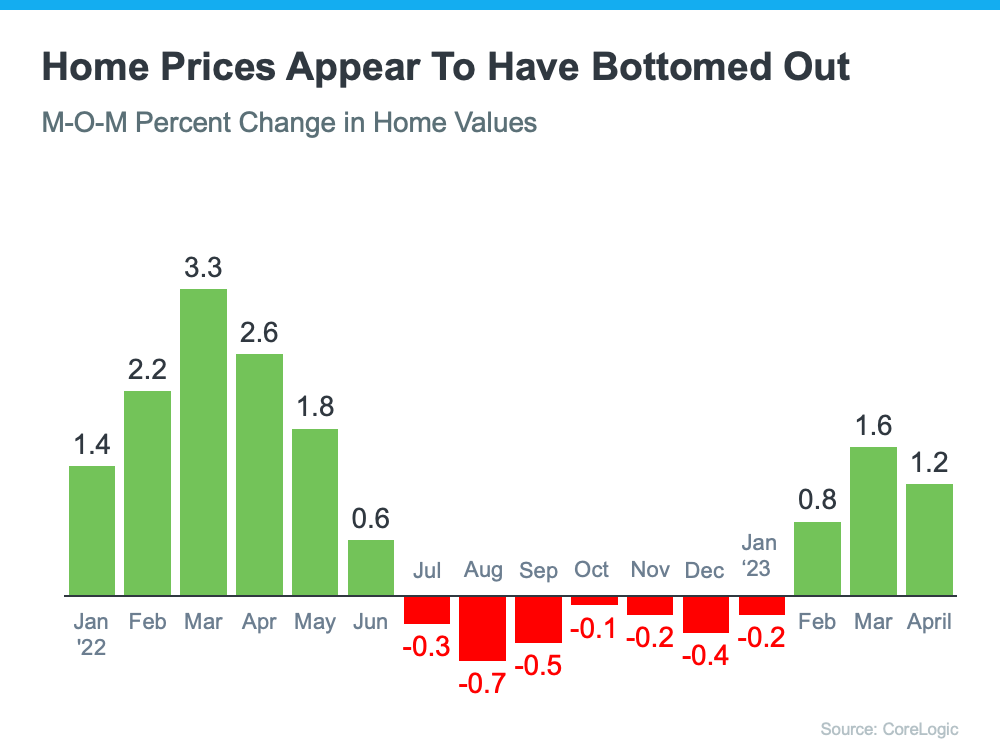
However, on a closer look at M-O-M home prices, we can see prices have actually been appreciating for the last several months. Those M-O-M numbers more accurately reflect what’s truly happening with home values: after several months of depreciation, it appears we’ve hit bottom and are bouncing back.

Here’s an example of M-O-M home price movements for the last 16 months from the CoreLogic Home Price Insights report (see graph below):

Why Does This Matter to You?

So, if you’re hearing negative headlines about home prices, remember they may not be painting the full picture. For the next few months, we’ll be comparing prices to last year’s record peak, and that may make the Y-O-Y comparison feel more negative. But, if we look at the more immediate, M-O-M trends, we can see home prices are actually on the way back up.

There’s an advantage to buying a home now. You’ll buy at a discount from last year’s price and before prices start to pick up even more momentum. It’s called “buying at the bottom,” and that’s a good thing.

Bottom Line

If you have questions about what’s happening with home prices, or if you’re ready to buy before prices climb higher, let’s connect.

What You Need To Know About Home Price News


The National Association of Realtors (NAR) will release its latest Existing Home Sales Report tomorrow. The information it contains on home prices may cause some confusion and could even generate some troubling headlines. This all stems from the fact that NAR will report the median sales price, while other home price indices report repeat sales prices. The vast majority of the repeat sales indices show prices are starting to appreciate again. But the median price reported on Thursday may tell a different story. 

Here’s why using the median home price as a gauge of what’s happening with home values isn’t ideal right now. According to the Center for Real Estate Studies at Wichita State University:

“The median sale price measures the ‘middle’ price of homes that sold, meaning that half of the homes sold for a higher price and half sold for less. While this is a good measure of the typical sale price, it is not very useful for measuring home price appreciation because it is affected by the ‘composition’ of homes that have sold.

For example, if more lower-priced homes have sold recently, the median sale price would decline (because the “middle” home is now a lower-priced home), even if the value of each individual home is rising.”

People buy homes based on their monthly mortgage payment, not the price of the house. When mortgage rates go up, they have to buy a less expensive home to keep the monthly expense affordable. More ‘less-expensive’ houses are selling right now, and that’s causing the median price to decline. But that doesn’t mean any single house lost value. 

Even NAR, an organization that reports on median prices, acknowledges there are limitations to what this type of data can show you. NAR explains:

“Changes in the composition of sales can distort median price data.”

For clarification, here’s a simple explanation of median value:

  • You have three coins in your pocket. Line them up in ascending value (lowest to highest).
  • If you have one nickel and two dimes, the median value of the coins (the middle one) in your pocket is ten cents.
  • If you have two nickels and one dime, the median value of the coins in your pocket is now five cents.
  • In both cases, a nickel is still worth five cents and a dime is still worth ten cents. The value of each coin didn’t change.

The same thing applies to today’s real estate market.

Bottom Line

Actual home values are going up in most markets. The median value reported tomorrow might tell a different story. For a more in-depth understanding of home price movements, let’s connect.

Ways To Overcome Affordability Challenges in Today’s Housing Market [INFOGRAPHIC]


Some Highlights

  • With so few homes on the market right now, widening the scope of your search to include nearby areas could help you find more options in your budget.
  • You can also work with a trusted lender to consider alternative financing options and search for down payment assistance.
  • If you’ve been searching for a home but are concerned about rising costs, make sure you have a team of trusted real estate professionals for expert advice.

The Three Factors Affecting Home Affordability Today


There’s been a lot of focus on higher mortgage rates and how they’re creating affordability challenges for today’s homebuyers. It’s true that rates climbed dramatically since the record-low we saw during the pandemic. But home affordability is based on more than just mortgage rates – it’s determined by a combination of mortgage rates, home prices, and wages.

Considering how each one of these factors is changing gives you the full picture of home affordability today. Here’s the latest.

1. Mortgage Rates

While mortgage rates are higher than they were a year ago, they’ve hovered primarily between 6% and 7% for nearly eight months now (see graph below):

As the graph shows, mortgage rates have experienced some volatility during that time. And even a small change in mortgage rates impacts your purchasing power. That’s why it’s so important to lean on your team of real estate professionals for expert advice to stay up to date on what’s happening in the market. While it’s hard to project where mortgage rates will go from here, many experts agree they’ll likely continue to remain around 6%-7% in the immediate future. 

2. Home Prices

Over the past few years, home prices appreciated rapidly as the record-low mortgage rates we saw during the pandemic led to a surge in buyer demand. The heightened buyer demand happened while the supply of homes for sale was at record lows, and that imbalance put upward pressure on home prices. However, today’s higher mortgage rates have slowed down price appreciation.

And, the truth is, home price appreciation varies by market. Some areas are seeing slight declines while others have prices that are climbing. As Selma Hepp, Chief Economist at CoreLogic, explains:

“The divergence in home price changes across the U.S. reflects a tale of two housing markets. Declines in the West are due to the tech industry slowdown and a severe lack of affordability after decades of undersupply. The consistent gains in the Southeast and South reflect strong job markets, in-migration patterns and relative affordability due to new home construction.”

To find out what’s happening with prices in your local market, reach out to a trusted real estate agent.

3. Wages

The most positive factor in affordability right now is rising income. The graph below uses data from the Bureau of Labor Statistics (BLS) to show how wages have grown over time: 

Higher wages improve affordability because they reduce the percentage of your income it takes to pay your mortgage since you don’t have to put as much of your paycheck toward your monthly housing cost.

Home affordability comes down to a combination of rates, prices, and wages. If you have questions or want to learn more, reach out to a real estate professional who can explain what’s happening locally and how these factors work together.

Bottom Line

If you’re planning to buy a home, knowing the key factors that impact affordability is important so you can make an informed decision. To stay up to date on the latest on each, let’s connect today.